How to Measure Radiology Department Efficiency with the Right Metrics
More exams don’t automatically mean a more efficient radiology department. To measure radiology department efficiency, track 4-6 core metrics in a dashboard, including productivity, workflow times, reporting, and equipment use. Read the numbers together to see where work moves smoothly and where delays or uneven workloads may be building.
Exam volume matters, but raw counts can hide case complexity and time spent on consultations, teaching, and other duties. A useful approach balances throughput with workload and reporting performance, so operational changes support timely care and sustainable work.
This guide covers which productivity metrics to track, how workload and report turnaround shape the results, and how to put the data to work in a clear dashboard. You’ll learn how to establish a baseline, compare results over time, and use the findings to identify practical workflow improvements.
Key Takeaways
- Build a baseline from operational data, then compare performance over time and across comparable teams.
- Interpret exam counts alongside case complexity and the work radiologists do beyond image interpretation.
- Use consistent reporting processes and turnaround measures to spot bottlenecks that affect report delivery.
- Turn dashboard trends into focused workflow changes, then monitor whether those changes improve performance.
What Are Radiology Productivity Metrics?
Radiology productivity metrics show how effectively a department uses staff, equipment, and time. Measure the patient journey from scheduling through imaging and final reporting to identify delays, workload imbalances, and errors.
Identify Productivity Measures and Benchmarks
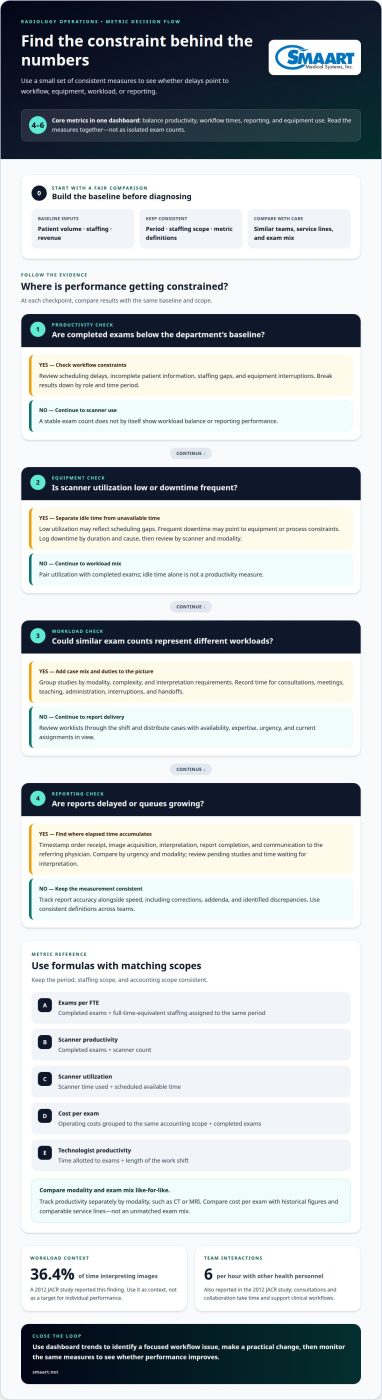
Set a baseline using patient volume, staffing, and revenue, then compare results over time and across comparable radiologists or departments. Track patient satisfaction, financial performance, staff productivity, and equipment utilization: exam counts alone do not show the full picture. For X-ray technologists, calculate productivity by dividing the time allotted to exams by the length of the work shift. Compare results with internal or external benchmarks, using consistent definitions.
Account for Department Productivity Factors
Separate factors affecting clinical output from workflow constraints, such as scheduling delays, incomplete patient information, staffing gaps, or equipment interruptions. These challenges can reduce completed exams or increase errors, even when staff are working at capacity. Measure non-clinical staff productivity through defined tasks, such as registrations completed, scheduling requests handled, or records corrected, alongside accuracy and queue delays. Review each measure by role and time period so workload differences are visible rather than hidden in department-wide totals.
Calculate Productivity by FTE, Scanner, and Modality
Calculate exams per FTE by dividing completed exams by the full-time-equivalent staffing assigned to the same period. Calculate scanner productivity by dividing completed exams by scanner count, and calculate productivity separately for each modality, such as CT or MRI. Keep the period and staffing scope consistent. To benchmark cost per exam, group operating costs using the same accounting scope, then divide costs by completed exams. Compare the result with the department’s historical figures and comparable service lines, not with an unmatched exam mix.
Track Equipment Utilization and Downtime
Record each scanner’s scheduled operating time, time in use, and unavailable time. Calculate utilization by dividing scanner time used by scheduled available time. Log downtime separately by duration and cause, such as maintenance or workflow interruption, and review results by scanner and modality. Low utilization may reflect scheduling gaps, while frequent downtime may point to equipment or process constraints. Pair utilization with completed exams so idle time alone is not treated as a productivity measure.
Radiologist workload and non-interpretive duties
Assess radiologist workload alongside imaging volume, case complexity, and duties outside interpretation. This balanced view helps hospital teams understand how staffing and worklist decisions affect patient care.
Assess Workload and Non-Interpretive Duties
Record interpretation time alongside consultations, multidisciplinary meetings, teaching, and administrative duties. These responsibilities take time away from image review but support clinical decisions and team workflows. A 2012 JACR study found radiologists spent 36.4% of their time interpreting images. It also reported six interactions per hour with other health personnel. Use these findings as context, not as a target for individual performance.
Map each radiologist’s scheduled duties against assigned cases. Include interruptions and handoffs rather than treating every hour as uninterrupted reading time. This helps explain why radiologists with similar exam counts may face different demands.
Account for Case Complexity
Group imaging studies by modality, complexity, and interpretation requirements. Equal study counts can represent different workloads when one list contains straightforward exams and another includes complex cases or additional comparisons. Track categories consistently across radiologists and review shifts with different case mixes separately.
For example, a day with fewer complex studies may require more interpretation time than a higher-volume list of routine exams. Avoid judging productivity by raw case totals alone. Pair volume with turnaround and workload context to distinguish lower throughput from a more demanding clinical mix.
Balance Workload and Manage Queues
Review worklists throughout each shift and distribute cases according to availability, expertise, urgency, and current assignments. Workload management tools and effective scheduling can help balance tasks among radiologists and technologists. Keep priority cases visible, and watch for queues that grow while qualified staff have capacity.
Track pending studies, time waiting for interpretation, and completed reports by worklist or modality. When delays cluster, investigate root causes such as uneven assignments, interruptions, or scheduling conflicts. Prioritize clinical duties and delegate appropriate non-clinical tasks where possible, so radiologists can focus on interpretation and patient care.
Standardized reporting and turnaround time
For modality benchmarks, compare like-for-like results and percentiles: the Imaging Performance Partnership report identifies a CT turnaround-time difference between facilities at the 25th and 75th percentiles. Measure workflow efficiency by tracking elapsed time from imaging order to final report, including key stages along the way.
Measure Turnaround Time and Report Accuracy
Record timestamps for order receipt, image acquisition, interpretation, report completion, and communication to the referring physician. Calculate turnaround time from a consistent starting point to the final report, then compare results by urgency and modality. Assess report accuracy alongside speed by reviewing corrections, addenda, and identified discrepancies. Use consistent definitions across teams, or apparent improvements may reflect different counting methods rather than better workflows.
Standardized report templates and voice recognition can support consistent report creation. Keep accuracy visible alongside turnaround time so faster reporting does not become the only performance goal.
Compare Turnaround Times by Modality
Separate CT, MRI, X-ray, and other study types before comparing report times. The Imaging Performance Partnership benchmark report shows a difference in CT turnaround between facilities at the 25th and 75th percentiles. Use percentile comparisons to understand relative performance, then examine case mix, staffing, and reporting processes that may explain the gap. Don’t apply one modality’s benchmark to another; study complexity and workflow stages differ.
Compare each modality with its own historical results and matched facilities. Keep urgent and routine cases distinct, since combining them can obscure delays affecting time-sensitive reports.
Track Workflow from Order to Final Report
Map each study from referral or order through scheduling, preparation, imaging, interpretation, report completion, and communication. Measure elapsed time between stages, not just total order-to-report time. A long interval before image acquisition, for example, points to a different bottleneck than a delay after interpretation. Track incomplete orders, missing patient information, and scheduling conflicts as possible sources of workflow friction.
Review stage-level patterns by modality and urgency. Then standardize protocols, refine scheduling, or improve report delivery where the data shows recurring delays.
Metric dashboards and implementation
Use a dashboard to turn operational data into decisions. Start with 4-6 core metrics, then review trends consistently instead of reacting to isolated results. To decide how to measure radiology department efficiency, connect each metric to a specific operational question.
- Choose measures tied to department goals. Select a balanced set, such as report turnaround, exams completed, equipment utilization, overtime, and patient satisfaction. Include measures of staff productivity and operational performance, not just volume. Keep definitions consistent: a completed report should mean the same thing across teams and review periods. A focused dashboard makes changes easier to spot without burying managers in unrelated data.
- Set up a reliable data flow. Identify the source of each metric, such as scheduling, reporting, staffing, or equipment records. Align time periods and categories before combining results. For example, modality-specific turnaround data should use consistent start and end points. A clear data dictionary helps teams interpret measures consistently and reduces confusion when reporting tools bring information together. This foundation makes it easier to measure radiology department efficiency using data teams can act on.
- Build views for decisions. Organize dashboard panels around practical questions: where are queues growing, which modality has lower utilization, and whether patient satisfaction is changing? Show current performance beside historical trends, and allow managers to filter by modality, site, or shift when those categories are available. Use visual alerts sparingly, so meaningful changes stand out instead of creating constant noise.
- Review results and act on patterns. Set a regular review rhythm and assign an owner to each follow-up. If report delays rise for one modality, investigate its workflow stages before changing staffing or protocols. Record the action taken and compare later results using the same definitions. This turns the dashboard into a continuous improvement tool, rather than a static scorecard. For help connecting radiology workflows and data, explore radiology workflow solutions.
SMAART Medical Systems
SMAART Medical Systems, Inc. helps hospitals and clinics manage radiology workflows with software designed to integrate with existing EMR and HIS platforms. SMAART-PACS, SMAART-RIS, and SMAART-SHARE support imaging management, reporting, and image sharing as part of a broader technology environment.
These tools support the operational systems behind productivity measurement, while department leaders define the metrics and review results. Start by identifying where your workflow creates friction, such as disconnected systems or delays moving information between imaging and reporting. Then consider which software offering fits that need and your existing environment.
Turn Your Metrics Into the Next Improvement
The next step is to make measurement part of routine operational planning. Decide who reviews performance, how findings lead to action, and when teams revisit those decisions. That cadence helps keep metrics connected to real workflow needs instead of letting dashboards become passive reports. As you refine how to measure radiology department efficiency, focus on making the information useful to the people responsible for improving daily processes.
When disconnected systems make imaging information, reporting, or sharing harder to manage, SMAART Medical Systems offers SMAART-PACS, SMAART-RIS, and SMAART-SHARE. Its solutions are designed to integrate with existing EMR and HIS platforms, helping connect technology across radiology operations.
To discuss how these offerings may fit your department’s workflow, contact SMAART Medical Systems. A clear next step can help your team move from tracking performance to making practical, informed improvements.
Frequently Asked Questions
What KPIs measure radiology department efficiency?
Useful KPIs cover throughput, access, quality, and resource use. Alongside completed exams, consider appointment availability, patient wait time, report corrections, repeat imaging, scanner downtime, and staff workload. Read related measures together: an increase in completed studies means less if repeat exams also rise. Choose indicators that answer a specific management question, such as whether a scheduling change reduced delays without affecting quality.
How to assess radiology scheduling, patient wait times, and appointment access?
Measure access from the patient’s perspective by tracking time from appointment request to the offered slot, then arrival to imaging. Separate cancellations, missed visits, and rescheduled appointments so each has a clear operational meaning. Compare patterns by modality, appointment type, and time of day. Long waits for one exam type, for example, may reveal a scheduling constraint hidden by department-wide averages.
How do radiology departments measure report accuracy, repeat imaging, and quality?
Use quality indicators that capture reporting and image acquisition. Track report amendments or corrections, and calculate repeat imaging by dividing repeated exams by total exams within the same period. Review repeat cases for causes such as positioning, protocol selection, or incomplete information. Pair these measures with quality assurance reviews so teams can distinguish isolated issues from recurring process problems and choose an appropriate improvement.
How to balance radiologist productivity with patient safety and burnout?
Balance productivity measures with clinical quality and workload context instead of making volume the sole target. Review case mix, interruptions, consultations, teaching, and administrative duties alongside completed reads. Sustained queue growth, increased corrections, or uneven assignments are signals to investigate. Discuss workflow barriers with staff and consider task distribution or scheduling adjustments before treating lower case counts as an individual performance problem.
What tools and dashboards can track radiology department efficiency?
Use a dashboard that brings operational measures into one view, supported by reliable data from scheduling, imaging, reporting, and staffing systems. SMAART-PACS supports medical image storage and distribution, while SMAART-RIS manages patient data and clinical scheduling. SMAART-SHARE supports secure image sharing and collaborative viewing. These offerings address different workflow needs; department leaders should align data sources and metric definitions before interpreting dashboard trends.
How do radiology efficiency benchmarks vary by hospital size, modality, and region?
Benchmarks are meaningful only when the comparison group has a similar service mix and measurement method. Compare modalities separately, then account for differences in case complexity, staffing, operating schedules, and facility scope. Regional comparisons also require consistent definitions and comparable populations. Use external reference points to identify questions for investigation, while relying on your department’s own trend data to assess whether a change improves operations.